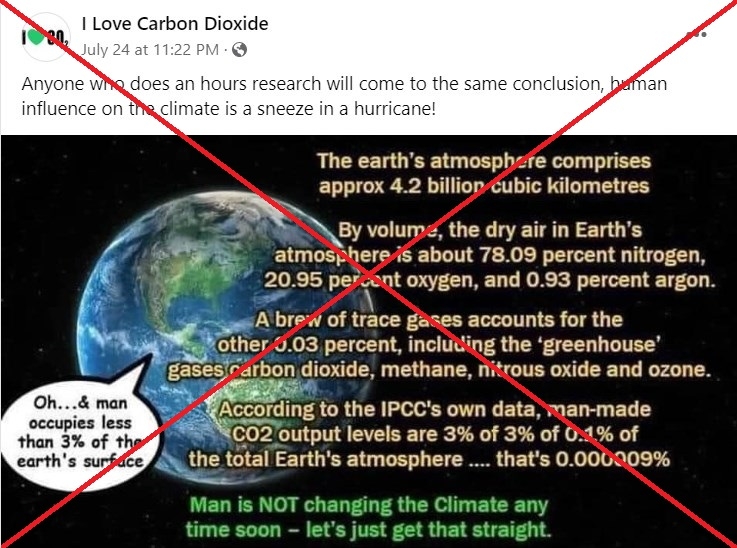
“Anyone who does an hours (sic) research will come to the same conclusion, human influence on the climate is a sneeze in a hurricane!” says a post shared on July 24 on a Facebook group named I Love Carbon Dioxide.
Under the message is a text graphic about the concentration of CO2 and other gases in the atmosphere. It notes CO2 is one of the “trace gases” that make up just 0.03 percent of the Earth’s atmosphere.
Citing the UN Intergovernmental Panel on Climate Change (IPCC), it states: “According to the IPCC’s own data, man-made CO2 output levels are 3% of 3% of 0.1% of the total Earth’s atmosphere… that’s 0.000009%.
“Man is not changing the Climate any time soon.”

The graphic was also shared on Facebook here and here.
However, it misrepresents the widely documented role of CO2 in global warming.
The line on “trace gases” appears to have been taken verbatim from this page on the site of the US space agency NASA.
But it omitted the part immediately following the “trace gases” information, where NASA explains the warming impact of CO2 and other trace greenhouse gases: nitrous oxide, methane and ozone.
“While these greenhouse gases make up just a tiny percentage of our atmosphere, they play major roles in trapping Earth’s radiant heat and keeping it from escaping into space, thereby warming our planet and contributing to Earth’s greenhouse effect,” NASA says.
CO2 has ‘big effect’
Atmospheric scientists contacted by AFP said most of the percentage compositions quoted in the post were approximately right, but the 0.03 percent of trace gases, dominated by CO2 — equivalent to some 300 parts per million (ppm) — is closer to the pre-industrial figure.
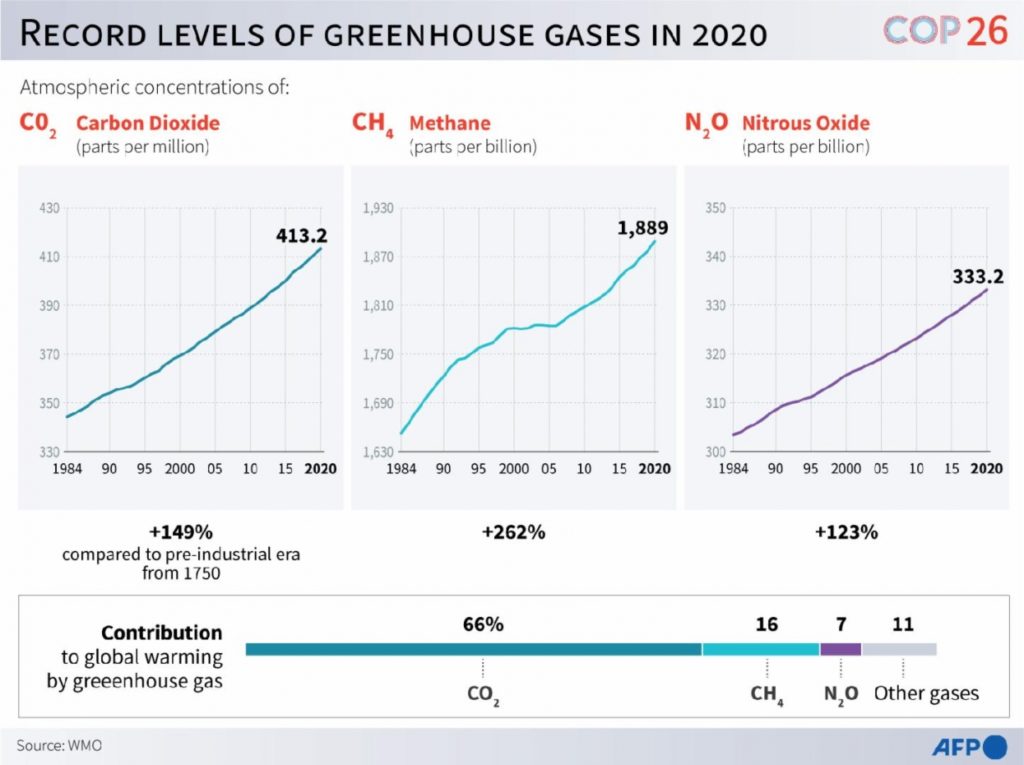
Since the 19th century with the mass burning of fossil fuels, that share has risen — and shot up since the 1960s to more than 400 ppm.
“So CO2 is a minor constituent of the atmosphere. Despite that, it has a big effect on planetary temperature because it absorbs infra-red heat radiation,” said Andrew Watson, an atmosphere specialist at the University of Exeter, in an email.
The IPCC’s major climate science report in 2021 contains a detailed chapter on the carbon cycle.
A graph on page 713 shows how different gases contribute to “radiative forcing” — the process in which more heat from the sun enters the Earth’s atmosphere than leaves it.
It is a key measure of human contribution to climate change.
The report says that from 1960 to 2019, CO2’s contribution to that heat change process was more than 60 percent.
‘Bizarre calculation’
The figure of 0.000009 percent given in the post for human-caused CO2 emissions appears to come from a blog article published in 2018.
“The figure they quote is wrong. The earlier article… has multiple errors,” said Watson.
“CO2 is currently at 420 parts per million, that is 0.042 percent of the atmosphere, so that’s a one-order-of-magnitude error.”
“The earlier article also does a totally bizarre calculation to get the result that 3 percent of the CO2 is due to humans,” he added.
Its method, he said, calculates the flow of CO2 into the atmosphere but not the net increase from human outputs.
Watson said that based on his calculations, “human emissions of CO2 every year… constitute about 0.0005 percent of the total atmospheric molar volume” — more than 50 times higher than the figure given in the post.
The source article includes graphics which it says are based on IPCC reports from 2001 and 2007. The 2007 report however states clearly that “among the greenhouse gases, CO2 increases have caused the largest (radiative) forcing” or heat shift.

Human activity drives global heating
Scientists track changes in greenhouse gas concentrations by measuring the “carbon budget” — the balance of gases from different sources in the atmosphere. This includes carbon given off and absorbed by natural processes — such as from land and oceans — as well as the smaller human-driven flows.
On this, the Facebook post “distorts reality,” said Chris Jones, an expert on carbon cycles at Britain’s Met Office weather service and a lead author on a 2013 IPCC report on the subject.
“Human activity is small compared to the gross terms of the budget. But as we know, natural fluxes approximately balance and hence human activity is entirely responsible for the imbalance,” he said in an email.
The observatories of the US National Oceanic and Atmospheric Administration (NOAA) have tracked the acceleration of CO2 concentrations in Earth’s atmosphere over the past half-century.
This NOAA graph shows how in that time atmospheric CO2 has risen in line with surging human-caused emissions.
Datasets from six organisations have tracked the related rise in global temperature.
“There is basic physics around how greenhouse gases work. You can measure their absorption in the lab and there is a huge wealth of evidence on both the radiative forcing and the attribution of observed changes to human activity,” said Jones.
“The change in CO2 since pre-industrial (times) is entirely human-caused, and this is from multiple lines of evidence,” he added. “In fact we have emitted about twice as much as this change, and nature has removed about half.”
Roland LLOYD PARRY
AFP Australia

- Home
- About Us
- Fact-checking at AFP
- Methodology
- Training
- Contact
- Corrections
- Media / Corporate offers
Copyright AFP 2017-2022. All rights reserved. Users can access and consult this website and use the share features available for personal, private, and non-commercial purposes. Any other use, in particular any reproduction, communication to the public or distribution of the content of this website, in whole or in part, for any other purpose and/or by any other means, without a specific licence agreement signed with AFP, is strictly prohibited. The subject matter depicted or included via links within the Fact Checking content is provided to the extent necessary for correct understanding of the verification of the information concerned. AFP has not obtained any rights from the authors or copyright owners of this third party content and shall incur no liability in this regard. AFP and its logo are registered trademarks.
