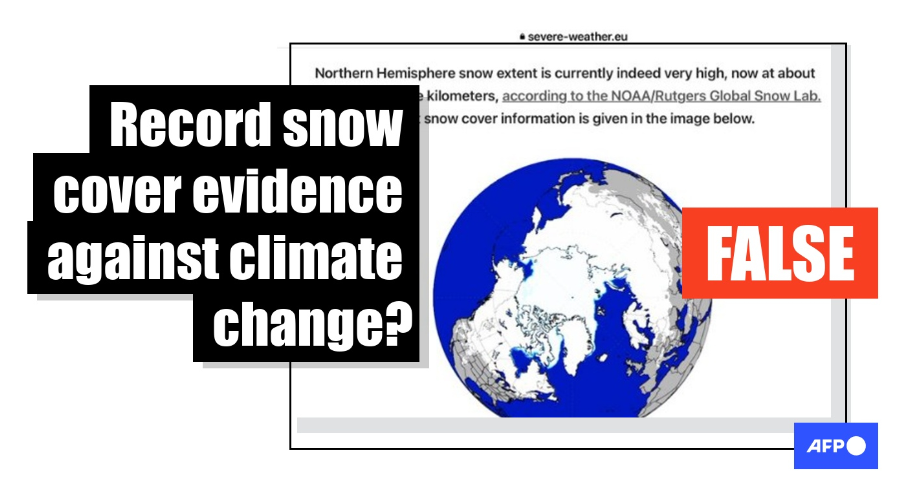
During the United Nations (UN) COP27 climate summit in Egypt, “November’s snowfall across the Northern Hemisphere was running at rates exceeding a half-a-century average,” says a December 3, 2022 article from Zero Hedge, a conspiratorial website that has previously published misinformation. “Most mainstream media outlets overlooked this data because it is an inconvenient truth for the climate change narrative they’re pushing.”
The claim was republished by blogs and shared in posts on Facebook and Twitter, including in French. An article tweeted by Patrick Moore, a prominent climate change denier who has made false claims about his links to Greenpeace, was shared thousands of times on Twitter.


The articles cite graphs and maps with data from the US National Oceanographic and Atmospheric Administration (NOAA) and the Global Snow Lab at Rutgers University in the state of New Jersey. The numbers indicate northern hemisphere snow extent reached about 41 million square kilometers (16 million square miles) in November, a 56-year high.
But experts say the data do not reflect the trend for average snow extent.
“You can’t link one map or even one month to global climate change. One needs to look over years if not decades to get a sense of where and why the extent of snow cover may or may not be changing,” said climatologist David Robinson, director of the Rutgers Global Snow Lab, in an email on November 28.
Snow cover decreased
More recent data show snow extent in the northern hemisphere has again dropped below the record level.
“Mid-November snow cover extent was well above normal across northern hemisphere lands. However, as November ends, that is not the case,” Robinson said. “For instance, there has been major melting of the earlier snowpack across much of North America such that extent for late November has fallen below normal.”
The Rutgers Global Snow Lab graph cited in the Zero Hedge article compares monthly readings for snow cover in the northern hemisphere to the maximum and minimum values recorded since records began in 1967, as well as the average.
The graph shows snow cover (purple line) surpassed the record (blue line) in mid-November. An updated graph published by the World Meteorological Organization (WMO) for the week ending November 28 showed that month’s reading had dipped below the record again.


A 2019 study examined six datasets stretching back to 1981 and found decreasing trends for both the extent and mass of snow in the northern hemisphere (NH).
The study noted “strong negative NH snow extent trends in early winter and spring and consistently strong, negative snow mass trends from November through May.” It also said “snow mass trends are negative through the entire snow season,” including in autumn.
Cherry-picking data to refute the trend of global warming is a common tactic of climate change deniers. AFP has debunked examples in several previous fact checks.
Snow anomalies
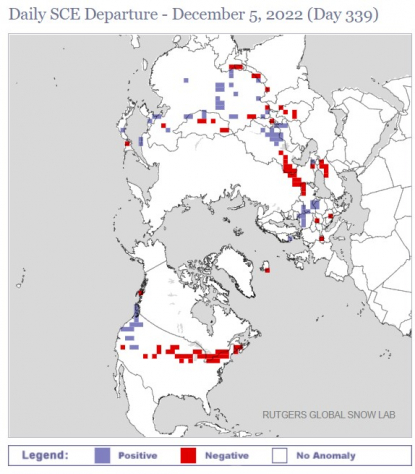
The chart below from the Rutgers Global Snow Lab shows in red a range of snow-free areas where there usually is some on December 5. They appear to exceed areas with snow where there is usually none, shown in blue.

“Snow cover is very variable from one year to the next. A very snowy year does not mean that the heating of the climate has stopped,” Marie Dumont, director of France’s national Snow Research Centre, told AFP on November 29. “You can very well have a very snowy year in a context of a warming climate.”
She added that “on average, according to the trends observed over several decades, there is an average decrease in snow cover” — but that “does not mean there is a decrease every year.”
Scientists agree that carbon emissions from humans burning fossil fuels are causing climate change, heating the planet and raising the risk of disasters such as heatwaves, floods and droughts.
The UN Intergovernmental Panel on Climate Change (IPCC) said in its 2021 report: “It is unequivocal that human influence has warmed the atmosphere, ocean and land.”
The left side of a chart from that report shows temperatures rising sharply over the past 150 years. On the right side of the chart, a blue line shows how much lower global temperatures would be without humans releasing greenhouse gases.

In its 2019 report on the oceans and cryosphere — frozen regions — the IPCC said: “Over the last decades, global warming has led to widespread shrinking of the cryosphere, with mass loss from ice sheets and glaciers … reductions in snow cover … and Arctic sea ice extent and thickness … and increased permafrost temperature.”
Produced by hundreds of scientists in more than 60 countries, the IPCC’s reports are the most comprehensive source of scientific knowledge on the climate.
AFP has fact-checked other false and misleading claims about climate change here.
Alexis ORSINI
AFP France
AFP USA
Translated by
Roland LLOYD PARRY

- Home
- About Us
- Fact-checking at AFP
- Methodology
- Fact-Checking Stylebook
- Training
- Contact
- Media/Corporate offers
- Corrections
Copyright AFP 2017-2022. All rights reserved. Users can access and consult this website and use the share features available for personal, private, and non-commercial purposes. Any other use, in particular any reproduction, communication to the public or distribution of the content of this website, in whole or in part, for any other purpose and/or by any other means, without a specific licence agreement signed with AFP, is strictly prohibited. The subject matter depicted or included via links within the Fact Checking content is provided to the extent necessary for correct understanding of the verification of the information concerned. AFP has not obtained any rights from the authors or copyright owners of this third party content and shall incur no liability in this regard. AFP and its logo are registered trademarks.
